
Over the last several weeks we have looked at four myths that keep investors from having a positive investment experience. Today, I outline a strategy based on decades of academic research, which I believe gives investors the best chance of reaching their goals. But first, here’s a summary of the myths we’ve covered:
Myth Reality
- Investing = Gambling Capitalism works – markets reward disciplined investors
- Timing Is Everything Trading is costly – Wall Street wins, investors suffer
- Superior Skill = Better Performance Few professionals beat the market, especially after fees
- Past Performance = Future Results Past winners rarely continue to outperform
Unfortunately, the investment industry is designed to entice investors to play the low-odds game of trying to pick stocks and time the market. While certainly there are a few that manage to find success this way, the overwhelming majority end up drastically under-performing the market. High fees and transactions costs are Wall Street’s best friends, but an investor’s worst enemy. Meanwhile, the quest to guess where the market is going or find the next Apple leads investors to make poor decisions.
Instead of relying on crystal balls, SwitchPoint embraces an evidence based approach to investing. Our philosophy is backed by decades of academic research on what actually drives stock market returns. We seek to maximize each investor’s return for their chosen level of risk by:
- Embracing Markets
- Diversifying Broadly
- Controlling Expenses
- Minimizing Taxes
- Maintaining Discipline
We believe following these principles helps our clients keep their share of market returns and gives them the best chance of reaching their goals.
Embrace Markets
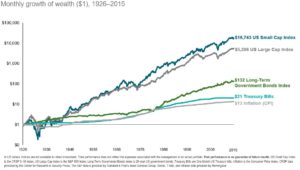
Embracing markets means believing that capitalism works and that market prices reflect all available information about a particular company. Instead of trying to outguess the market, we seek to harness the power of markets, putting the collective knowledge of millions of other investors to work in your portfolio. Over time, markets have rewarded disciplined investors for taking risk and providing capital.
Since markets reward investors for taking risks, one of the primary decisions in designing your investment portfolio is determining which risks to take.
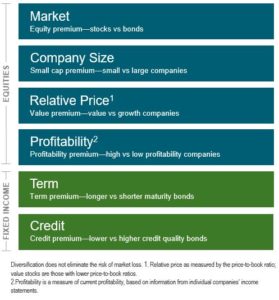 Academic research has identified several characteristics, or risk factors, that drive stock and bond returns.
Each of these factors has been shown to increase the return of a portfolio. For example, the equity premium says that stocks tend to outperform bonds. That doesn’t mean that everyone should only own stocks. While stocks tend to perform better than bonds, they are also much riskier, and usually shouldn’t be used for short-term needs.
Our job is to help our clients formulate a strategy that exposes them to the right risks to help them meet their individual goals.
Diversify Broadly
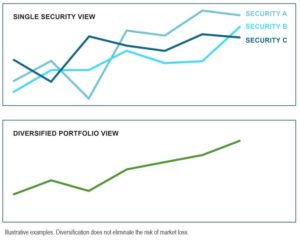 While the risks above have been shown to lead to higher returns, not all risks are rewarded equally. For example, the risk an investor assumes when he puts all his money into a single company stock is not a risk that the market rewards. This risk, known as idiosyncratic or company-specific risk, can be diversified away. Consider the illustration to the right.
A well-diversified portfolio can provide the opportunity for a more stable outcome as some companies do well when others are struggling.
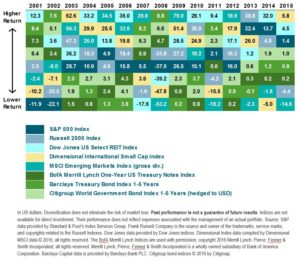
Not only do we diversify across large U.S. companies, but we seek additional diversification by investing across different countries and asset classes.
As this illustration shows, no single asset outperforms every year. By holding a globally diversified portfolio, investors are positioned to capture returns wherever they occur.
Control Expenses
Historically, many investors have treated fees as an afterthought. When quoted as a percentage, they seem so trivial. However, many fees borne by investors aren’t even visible. In addition to the stated expense ratio of a mutual fund, which averages a little over 1%, mutual funds also incur transactions costs. These costs have been estimated to be about 0.5% per year on average.1
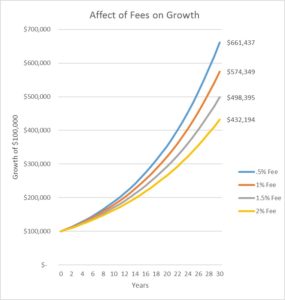 Now 1.5% may not seem like a lot, relative to your whole portfolio. But consider that if your average return is 7% per year, 1.5% represents over one-fifth of your return. In other words, every year Wall Street is keeping 20% of your returns! The chart to the right shows how those fees can add up over time.
Fees do matter. We strive to minimize fees for our clients by only paying for the things that add value, like careful portfolio construction and implementation, and not paying for things that are unlikely to add value, like market timing and stock picking.
Minimize Taxes
Taxes, like fees, have the ability to quietly erode your portfolio returns. In the end, what matters is not how well your portfolio performs, but how many dollars you get to keep.
As comprehensive wealth managers, we work with our clients and their CPA’s to design tax-efficient strategies for their investments. These include the use of tax-favored retirement accounts, tax-loss harvesting, strategic asset location, gifting strategies, tax-efficient mutual funds and tax-free bonds.
Maintain Discipline
Whether it’s the newscaster predicting disaster or Uncle Bob at Thanksgiving dinner warning about something he read on the internet, the temptations to abandon ship are sure to come.
However, successful investing requires looking beyond the concerns of today to the long-term growth potential of markets.
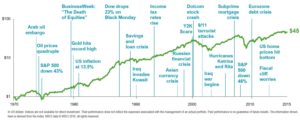
Sadly, Wall Street and the financial media feed investors’ worst impulses – the emotional responses of fear when things are falling apart and greed when things are going well. This is a recipe for disaster, leading to buying high and selling low, as well as higher fees, transactions costs and taxes.
Investors’ tendency to buy high and sell low is commonly referred to as the behavior gap. Several studies have attempted to determine the size of this gap – the difference between what the stock market returns and what investors actually earn.
What did they find? 2% – that’s right, investors shoot themselves in the foot to the tune of about 2% each year!2
One of the most important jobs of a financial advisor is to help investors maintain discipline so that they can take full advantage of the returns the market generates. The way we do this is by helping our clients understand the risks they are taking, and why they are taking them. Then we act as a sounding board and accountability partner when markets become volatile.
Which game will you play?
As an investor, you have a decision to make.
Option 1 – you can choose to accept that markets work. You can choose to work with an advisor who can help you understand how much risk you need to take in order to reach your goals. Then you can structure a portfolio that seeks to maximize your return by diversifying broadly and minimizing fees and taxes. You can choose to stay invested when the going gets tough, knowing that your instincts are likely to betray you and that the success of your plan doesn’t depend on avoiding every market decline.
Option 2 – you can choose to accept what Wall Street is selling. You can decide that your managers are among the few that will be able to overcome the extra 1.5% in management fees and transactions costs and consistently beat the market. You can choose to believe that while the average person costs themselves 2% per year trying to time the market and pick hot stocks or funds, you are different.
I can tell you that after analyzing hundreds of mutual funds and investment strategies, and seeing hundreds of actual investor portfolios, Option 1 is only strategy that I recommend for my clients.
If you are interested in structuring your portfolio around your needs and goals and seeing what you could save by embracing an evidence based approach, click here to schedule a complimentary, no-obligation introduction.